Energy Usage Statistics
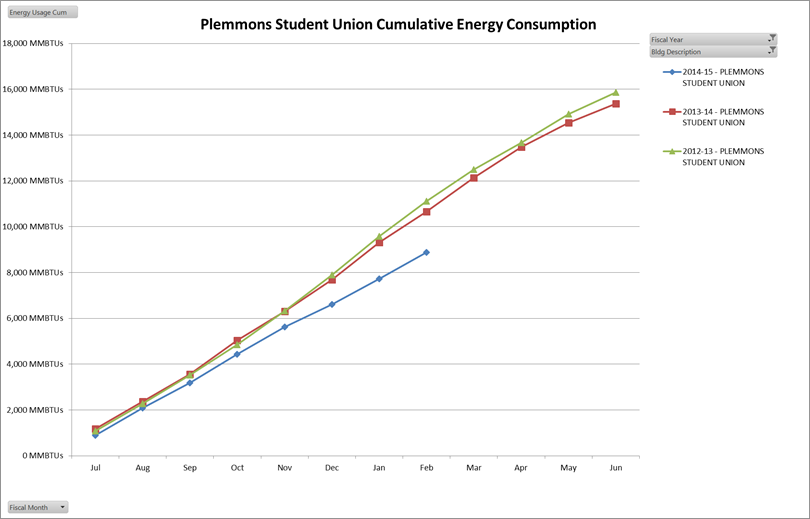
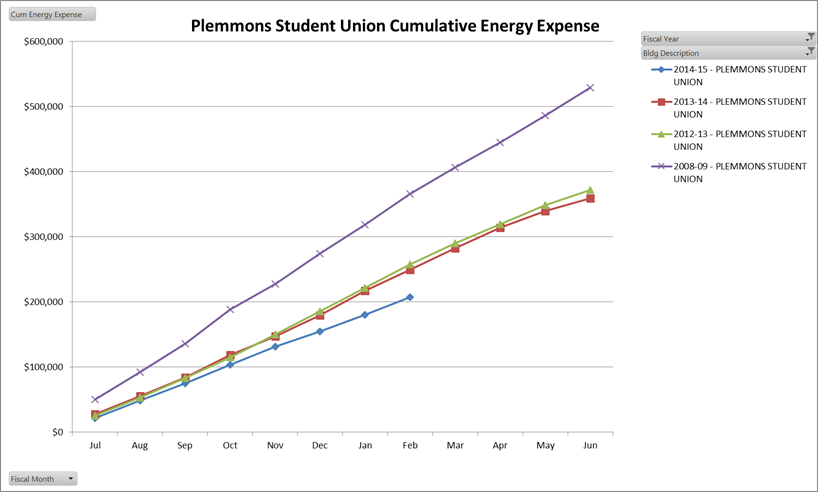
Spend a moment on the three graphs below and you will begin to understand the power of these changes in our facility, both environmentally and economically.

The top light blue line is the electricity consumption for 2009-10 (from July through June).
The dark blue line is the electricity consumption for 2013-14.
In 2009-10 the PSU used 2,565,200 kWh. In 2012-13 it used 1,955,200 kWh, a 24% drop in consumption while increasing square footage by 50%. That avoided about $55,000 in today’s energy dollars in electricity alone for 2012-13, or the same as:
- building about 6 of the ASU Wind Turbines (at a cost of $3,000,000), or
- providing enough power for 47 average NC houses for a year, or
- avoiding burning 628,000 pounds of coal.
Digital Controls and Events2HVAC (2014-2015)
In the past 3 months of operation, by not using energy that the PSU has typically used, the PSU has saved more electricity than the large ASU Wind Turbine puts out in a single year (125,000 kWh avoided vs. 108,000 kWh generated from the turbine).

As you can see, the cost savings is roughly $40,000 from this same time last year, and roughly $170,000 from where we were in 2008-2009! We are excited and interested to see the difference a whole year will make under this new system.

This is amazing data, and shows that within only three months of having the digital controls installed throughout the facility, and interfacing with Events2HVAC, we were already reaping some incredible rewards! We will update this information as new data becomes available to us.